
Data & Outcomes
See Growth as It Happens
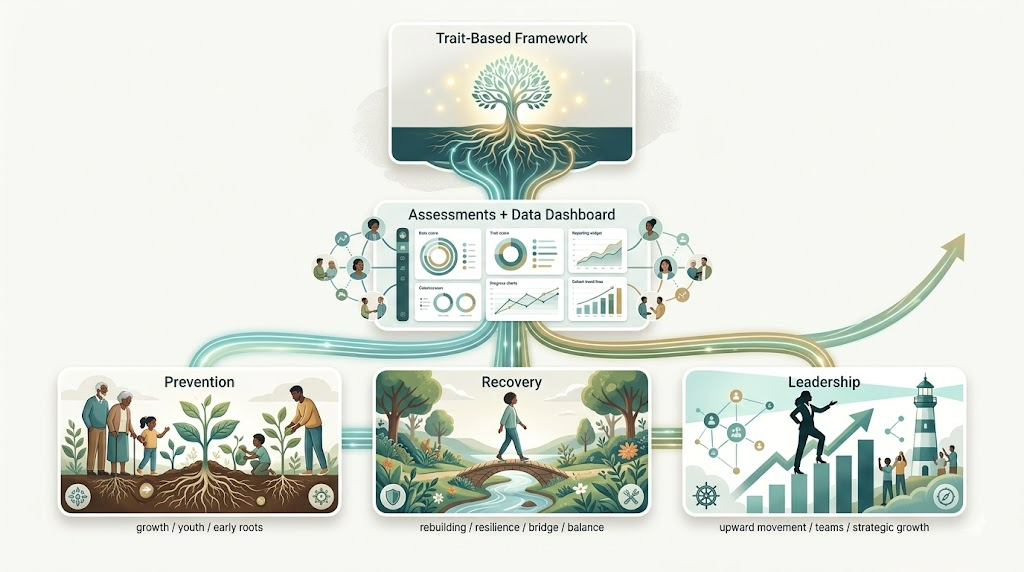
The Trait-Based Framework includes a digital dashboard that allows organizations to track measurable growth in real time across prevention, recovery, and leadership pathways.
From individual participant insights to cohort-level reporting and multi-site benchmarking, the system helps leaders understand what is changing, what is working, and where to strengthen support next.

More Than Curriculum. A Complete Measurement System.
The Trait-Based Framework combines:
curriculum
assessments
facilitator / ambassador preparation
real-time outcome tracking
cohort and grant reporting
cross-site benchmarking
What Organizations Can Measure Across the Framework
From individual participant insights to organization-wide reporting, the Trait-Based Data Dashboard helps leaders see growth across identity, resilience, emotional health, and pathway performance in real time.
Individual Progress
Track growth for each participant across core traits, resilience, and reflection milestones.
Program Impact Reporting
Generate grant-ready and board-ready evidence of measurable outcomes.
Cohort Growth Trends
See how classrooms, groups, recovery cohorts, or leadership cohorts develop over time.
Cross-Site Benchmarking
Compare outcomes across locations, schools, campuses, treatment centers, or organizational teams.
Anxiety + Depression Delta
Monitor changes in anxiety and depression indicators alongside trait development.
Individual Progress
See how prevention, recovery, and leadership pathways perform within the same ecosystem.
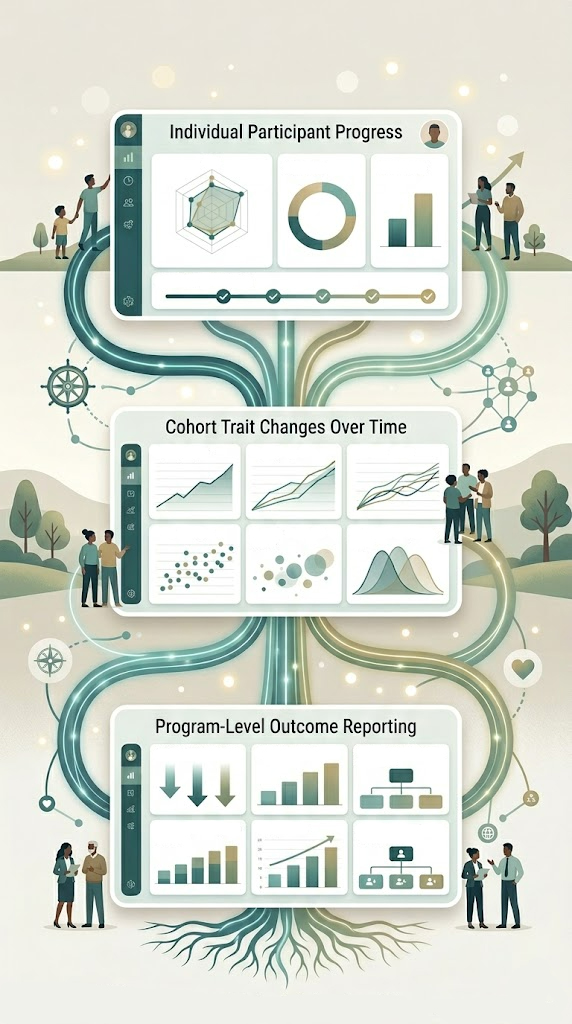
What the Dashboard Can Show
Individual participant progress
trait radar chart
pre/post score movement
milestone completion
Cohort trait changes over time
line graphs
cohort trend lines
resilience score movement
Program-level outcome reporting
anxiety/depression delta
retention indicators
completion rates
engagement lift
One Measurement Layer Across Three Pathways

Clinical and Recovery Outcomes in Real Time
Treatment providers can monitor participant progress throughout the recovery process, including:
Simple framework visual / stacked flow
trait development shifts
anxiety and depression movement
cohort engagement
retention indicators
program completion trends
This supports operational visibility for executive directors, clinical directors, justice diversion teams, and peer recovery organizations.
Built for the People Responsible for Outcomes
For Executive Directors
Board reporting, grants, program visibility, multi-site comparison
For Clinical Directors
Participant movement, retention, anxiety/depression change, cohort effectiveness
For Justice / Diversion Programs
Dignity-centered accountability metrics and long-term change visibility
For Schools + Districts
Student identity growth, engagement, and classroom-level shifts
For Workforce + Leadership
Trait development across teams and leadership cohorts
Want to See the Dashboard in Your Setting?
Whether you serve students, participants in recovery, or organizational leaders, the Trait-Based Data Dashboard helps you measure what matters most.